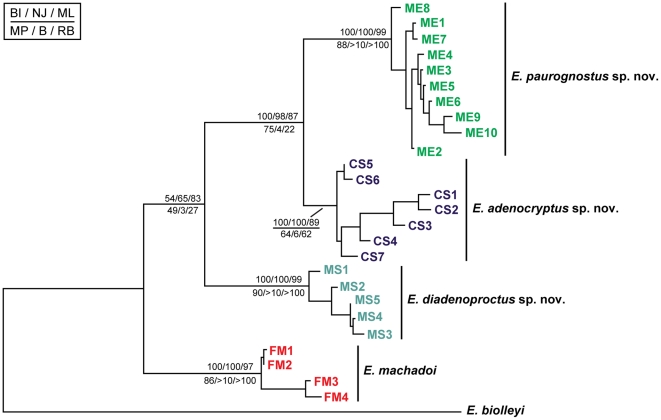
Figure 6. Maximum Likelihood topology amongst onychophoran specimens from different localities.
Combined mitochondrial data sets (COI + 12S rRNA), with E. biolleyi as an outgroup. Bayesian posterior probabilities and bootstrap values are given in the following order: BI/NJ/ML//MP/Bremer/Relative Bremer index decay. Abbreviations: CS, Córrego dos Ferreiras; FM, RPPN Feliciano Miguel Abdala; ME, Mata do Eremitério; MS, RPPN Mata do Sossego.

