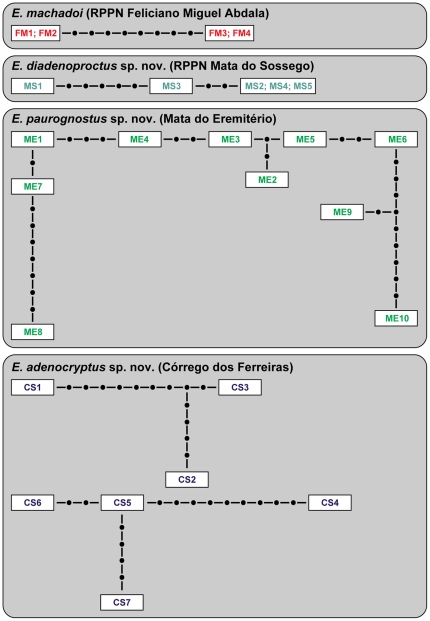
Figure 7. Haplotype networks for the COI sequences of Epiperipatus specimens from different localities.
Abbreviations as per Table 2. The connection probability was set to 95% (see ref. [48]). Each dot indicates one missing or unsampled haplotype. Two or more names in one frame represent identical genotypes.

