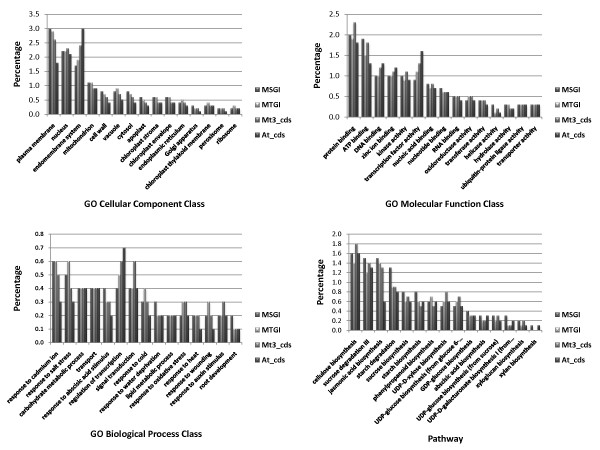
Figure 2.
Comparison of percentage distribution of gene ontology and pathway classifications using four reference databases. The percentage distributions of gene ontology (GO) classes and pathways are shown for the following reference databases: (1) the Medicago sativa Gene Index (MSGI 1.0) assembled in this study, (2) the Medicago truncatula Gene Index (MTGI 9.0), (3) the M. truncatula coding sequences (Mt3.0 cds), and (4) the Arabidopsis coding sequences (At cds).

