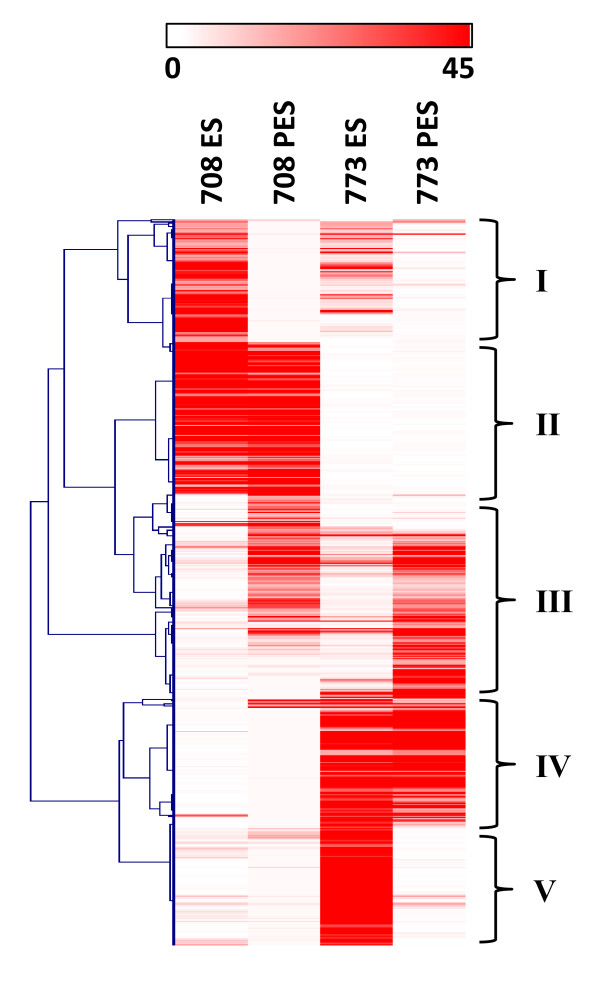
Figure 5.
Hierarchical clustering analysis of the top 200 most differentially expressed genes selected from pair-wise comparisons. Pair-wise comparisons of gene expression were made between stem tissues (ES, PES) in alfalfa genotypes 708 and 773. The RPKM-normalized expression counts for each gene in each library are represented by intensity of the red color on a 0 to 45 scale. Dark red (scale intensity 45) indicates genes with RPKM-normalized expression counts ≥ 45. See Methods for details. Groups I and III, genes differentially expressed in a tissue-specific manner; Groups II and IV, genes differentially expressed in a genotype-specific manner; and Group V, genes differentially expressed in both a genotype- and tissue-specific manner. A complete list of the genes, RPKM-normalized expression counts, and corresponding MapMan functional categories are provided in Additional file 20.

