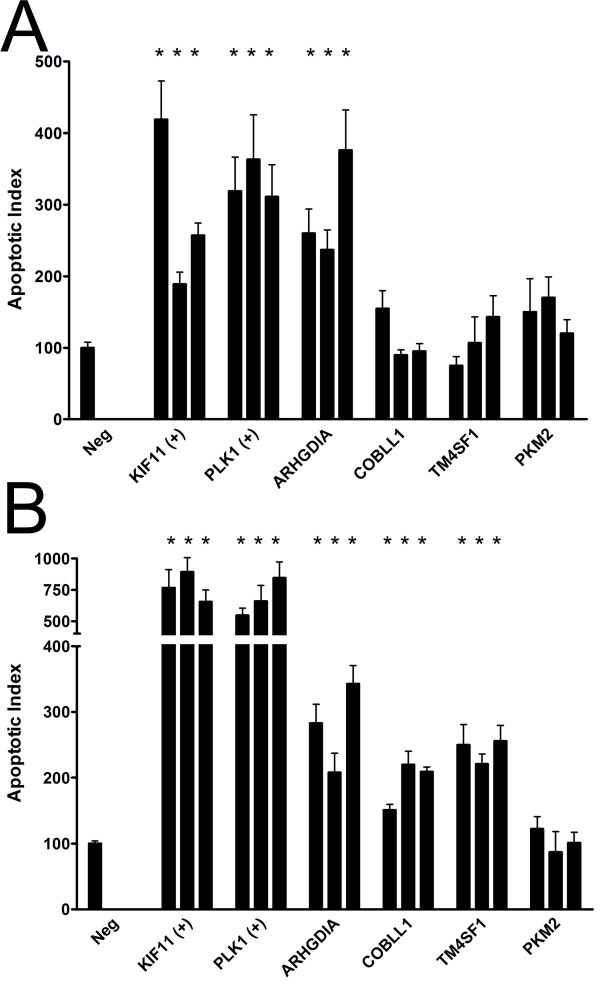
Figure 3.
Quantification of apoptosis after knockdown of MPM prognostic genes in cultured cells. The Apoptotic Index was calculated as described in the Methods in normal (A) and tumor (B) cells transfected with 3 different siRNA molecules per gene (as represented by individual bars) targeting MPM prognostic genes ("ARHGDIA", "COBLL1", "TM4SF1", "PKM2"), positive control genes ("KIF11", "PLK1"), or non-specific siRNAs as negative controls ("Neg"). Error bars, SEM. *, statistically significant (P < 0.00069) relative to negative control.

