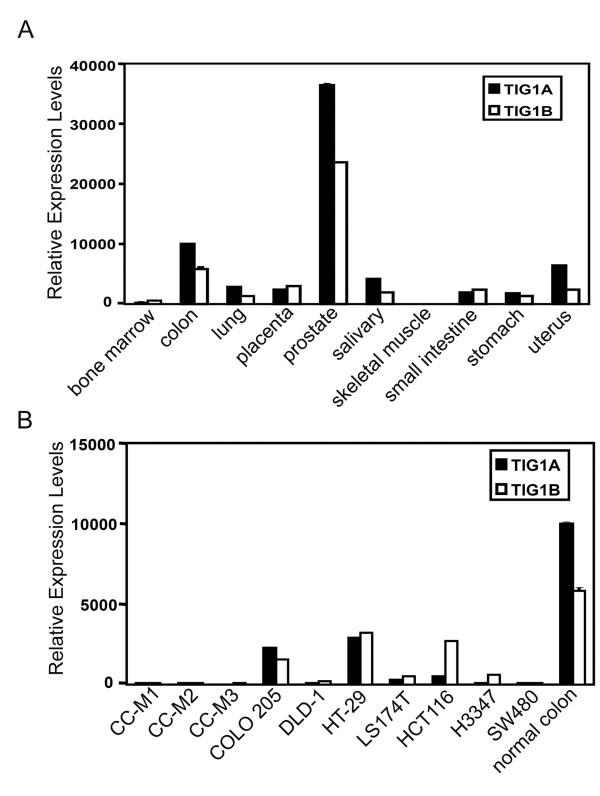
Figure 1.
TIG1A and TIG1B expression in normal tissues and colon cancer cell lines. Real time RT-PCR analysis of TIG1A and TIG1B mRNAs from normal human tissues (A) and colon cancer cell lines (B). Relative TIG1A and TIG1B mRNA levels were first normalised to GAPDH levels and then normalised to TIG1A levels in the normal colon, which was set at 10,000 units. Data represent the means and SDs from triplicate sample wells.

