Figure 6.
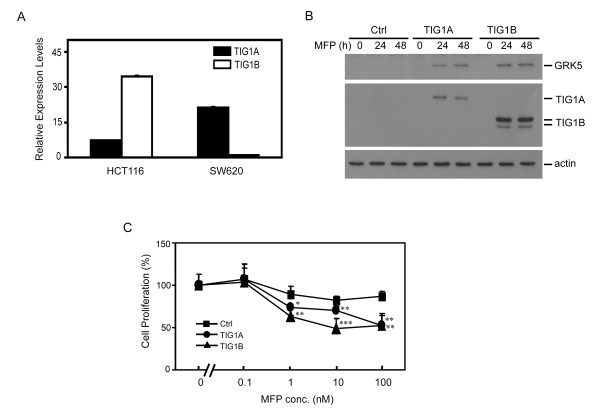
Effect of stable TIG1 expression on GRK5 expression and cell growth of SW620 colon cancer cells. (A) Real time RT-PCR analysis of TIG1A and TIG1B mRNA levels from HCT116 and SW620 colon cancer cell lines. (B) GRK5 expression in inducible TIG1 stable cells established from SW620 cells. Control or inducible TIG1A and TIG1B stable cells were plated overnight and then incubated with 5 nM MFP for 0 to 48 h. Expression of GRK5, TIG1 isoforms, and actin were analysed by Western blotting. (C) Effects of TIG1 isoform expression on SW620 cell growth. Inducible TIG1 and control stable clones were plated in triplicate overnight and then incubated with the indicated concentrations of MFP for 48 h. Cell proliferation was measured using the WST-1 method. Data represent the mean and SD of the percentage of cell proliferation performed in triplicate. *, P < 0.05; **, P < 0.01; ***, P < 0.001 compared with control stable cells incubated with the indicated concentration of MFP. Ctrl, control.

