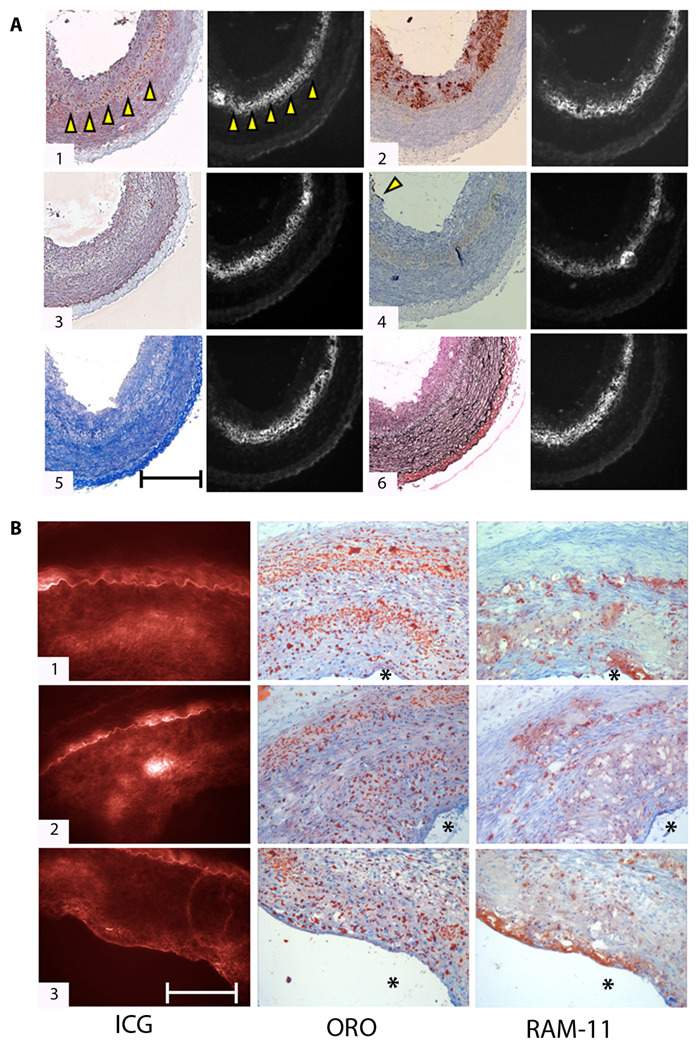
Fig. 2.
Histological assessment of ICG targeting of rabbit atheroma. (A) Correlative light microscopy and fluorescence microscopy of ICG deposition in atherosclerosis reveals ICG colocalization with lipid-rich and macrophage-abundant areas of atheroma sections. (1) Oil red O (ORO) stain of neutral lipid shows colocalization with ICG signal (arrowheads highlight the lipid-rich zone). (2) RAM-11–positive macrophages (dark brown stain) also colocalize with ICG, particularly in dense lipid-associated areas. (3) Immunoreactive smooth muscle cells (alpha-actin; stained brown) minimally colocalize with the matched ICG fluorescent area. (4) A few endothelial cells (CD31+) are present at the luminal surface (arrowhead). (5) Collagen (stained blue with Masson’s trichrome) and (6) elastin fibers (stained black with von Gieson’s) show very little colocalization with ICG. All histological slices are adjacent (6 µm). Fluorescence microscopic images of ICG distribution (854 nm) in all sections were obtained for each slice before staining. Scale bar, 200 µm. (B) Histopathological and fluorescence microscopic deposition of ICG in atheroma sections from three different animals. (1–3) From left to right: ICG fluorescence (845 nm, false-colored red), ORO staining of neutral lipid, and RAM-11+ macrophages. Within each group, all images are from adjacent sections (6 µm). Asterisk (*) denotes lumen. Scale bar, 100 µm.

