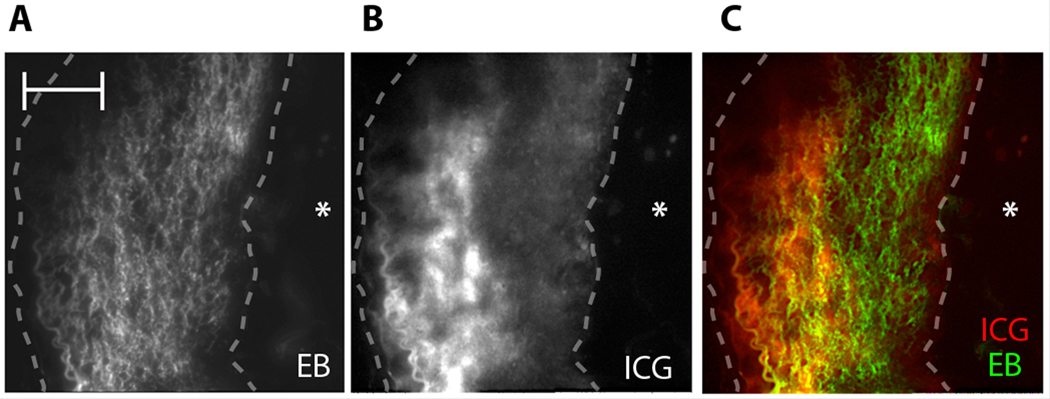
Fig. 4.
ICG atheroma-targeting profile in comparison to the Evans blue vascular permeability agent. (A) Fluorescence microscopy of Evans blue (EB) (710 nm) demonstrates homogenous signal enhancement in atheroma areas, indicating an impaired endothelial barrier. (B) ICG NIRF signal (845 nm) from the same section demonstrates focal signal in the deeper intimal plaque area. (C) A fusion image further illustrates the difference between ICG (red) and Evans blue (green) localization in an atheroma. Asterisk (*) denotes the location of the lumen. Dashed line outlines atheroma. Scale bar, 100 µm.

