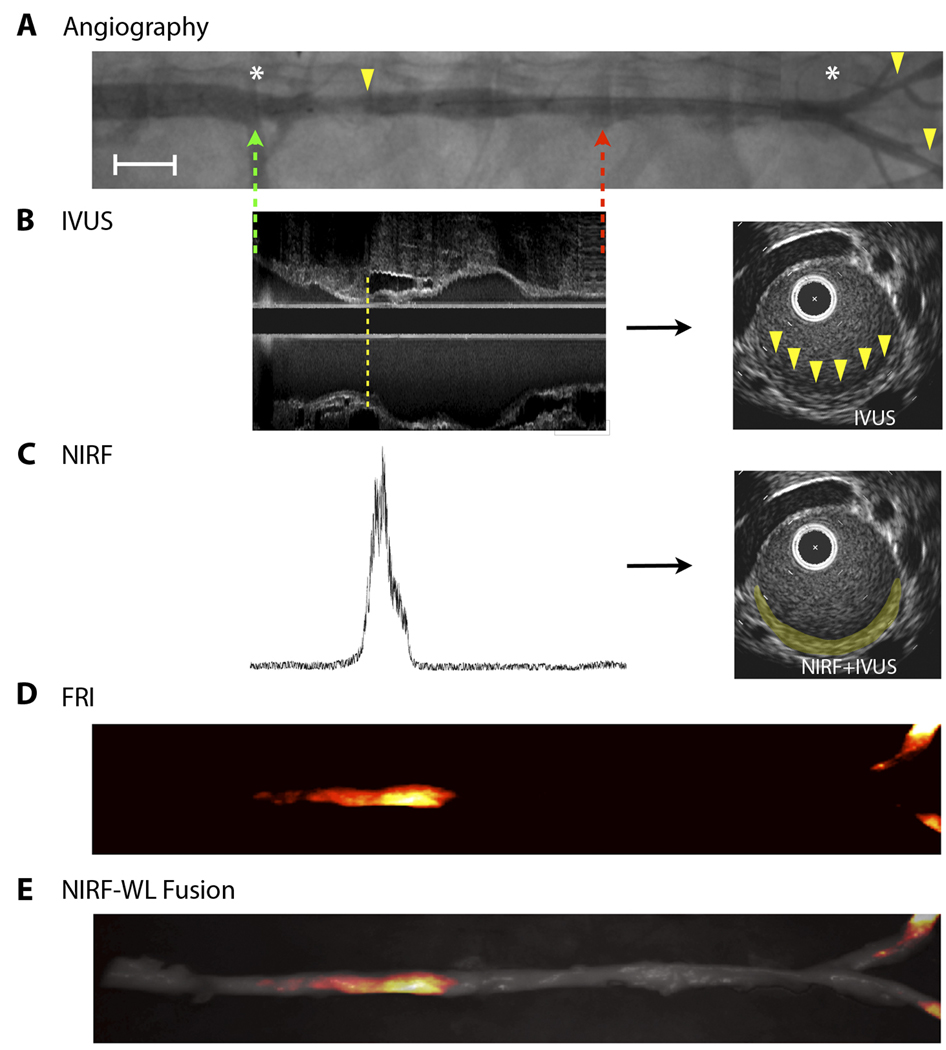
Fig. 6.
In vivo intravascular NIRF guidewire sensing of ICG localized in atherosclerotic plaques in rabbits. (A) X-ray angiographic images of aortic and iliac luminal narrowings (yellow arrowheads). Green and red dotted arrows represent the start and end of the NIRF guidewire pullbacks, respectively. The white asterisks demarcate arterial branch points. Image formed by merging two overlapping angiograms. Angiography, in combination with fiducial landmark coordinates from radiopaque tips on both the optical and IVUS catheters (not shown), allowed for co-registration of the NIRF and IVUS datasets. Scale bar, 1 cm. (B) IVUS longitudinal image obtained from an aortic atheroma-bearing animal (left). A small plaque (intimal thickening) is evident at the lower edge of the dotted yellow line, as seen further on the corresponding axial image (right, yellow arrowheads). (C) Fifteen minutes after ICG injection, a NIRF guidewire signal trace was recorded at 780 nm during automated pullback (left). The NIRF signal (right, false-colored yellow) was fused onto the IVUS-demarcated atheroma in the axial slice shown in (B). All longitudinal images were scaled on the same unit length and matched on the same fiducial markers. (D) Ex vivo fluorescence reflectance images (FRI) show enhanced ICG signal in aortic and iliac plaques (fire color lookup table). (E) Overlay of FRI with the white light (WL) image.

