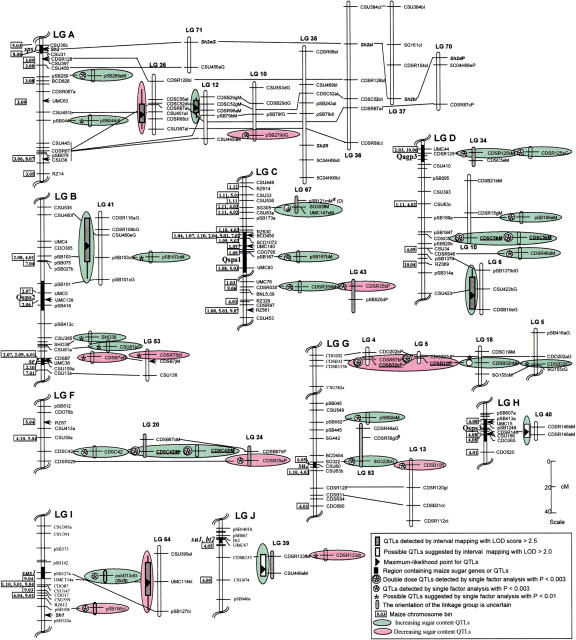
Figure 1.
Comparative mapping of sugar content QTLs. Bars and whiskers indicate 1 and 2 LOD likelihood intervals. Solid lines connect homologous loci on different sugarcane and sorghum linkage groups. Arrows indicate the inferred locations of markers used to align the homologous linkage groups among maize, sorghum, and sugarcane based on published (Ming et al. 1998) and unpublished data (M. McMullen and E. Coe, pers. comm.). Individual sorghum linkage groups are represented by LGs A to J. Sugarcane linkage groups from four parental varieties are indicated by the last letter of the marker name: G (Green German); M (Muntok Java); I (IND 81–146); P (PIN 84–1). Approximate map positions of double-dose (#) markers are inferred by the method of Da Silva (1995). The letters in parentheses following the marker name represent the sorghum linkage groups where the marker mapped, if different from the corresponding location shown. Only regions that contain, or are homologous to, QTLs are shown. Twenty-eight of the 36 sugar content QTLs are shown on this figure, along with nine putative QTLs. The markers associated with the remaining eight sugar content QTLs could not be mapped in sorghum.

