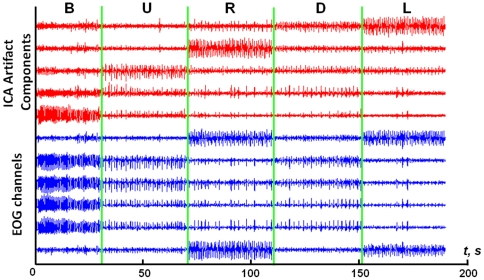
Figure 7. Signals from EOG electrodes for one of the subjects and corresponding independent components, identified as EOG-related for this subject.
EOG signals are presented in blue (6 lower curves), corresponding independent components are displayed in red (5 upper curves). From left to right, signals correspond to: blinking (B), moving eyes upwards (U), to the right (R), downwards (D) and to the left (L). Each curve is normalized by the standard deviation.

