Figure 1.
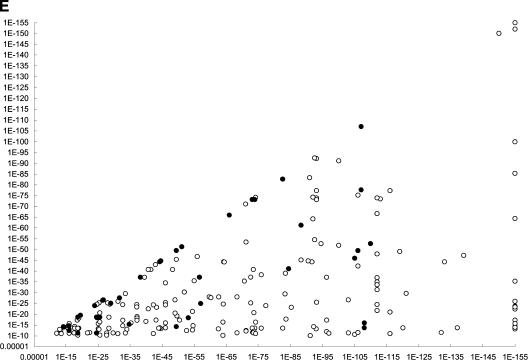
Experimentally verified interactions between Saccharomyces cerevisiae and Caenorhabditis elegans. (A–D Yeast diploid cells expressing each of 35 C. elegans potential interologs. Pairs are arranged in the order described in Table 2. The five patches at the bottom are controls (negative control on the left side and controls of increasing interaction strength towards the right side). See Vidal (1997) for a detailed description of these controls. (B) β-Galactosidase assay to detect the expression of GAL1::lacZ. (C) Growth assay on SC-Leu-Trp-His, +20 mM 3AT plates to detect the expression of GAL1::HIS3. (D) Growth assay on SC-Leu-Trp-Ura plates to detect the expression of SPAL10::URA3. (E) Conservation of interactions. Each C. elegans protein pair tested was plotted according to two E-values. The first E-value corresponds to the conservation between the X (from yeast) and X‘ (from C. elegans) proteins while the second E-value corresponds to the conservation between the Y (from yeast) and Y‘ (from C. elegans) proteins. The smaller of the two E-values was plotted on the X-axis and the greater on the Y-axis. The C. elegans protein pairs that tested positive in the two-hybrid system are labeled in black.


