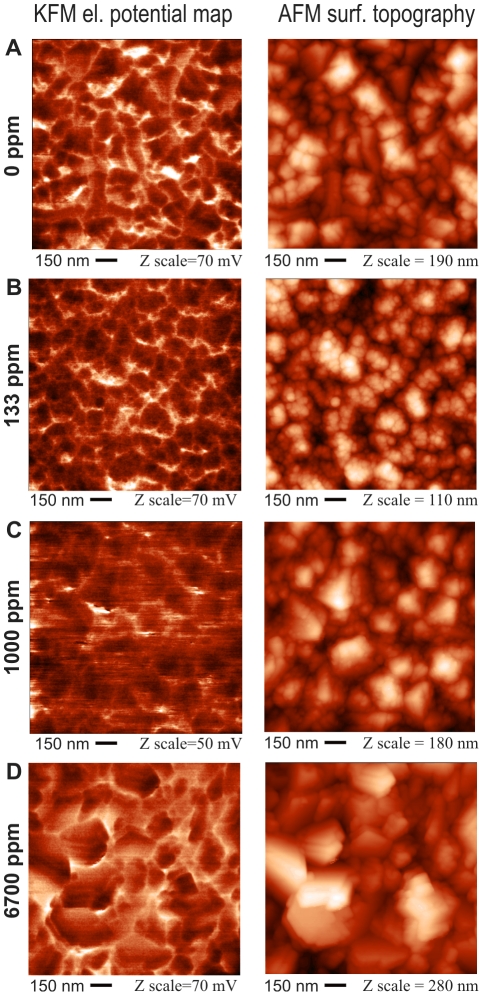
Figure 2. Microscopic images of surface potential variations as detected by Kelvin force microscopy (left column), and surface topography as detected by atomic force microscopy (right column) on NCD samples without boron doping (A) and with nominal boron doping of 133 ppm (B), 1000 ppm (C), and 6700 ppm (D).
The AFM oscillation amplitude was 100 nm, the setpoint was 50%. The KFM lift height was 30 nm. The detection frequency was 75 kHz.

