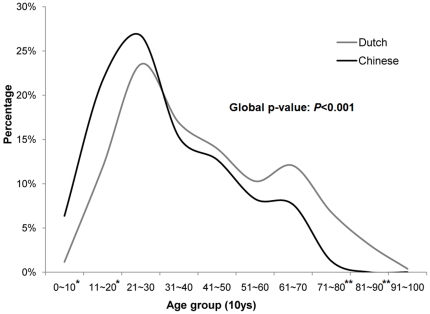
Figure 1. Age distribution of Dutch and Chinese cHL patients in consecutive 10-year intervals.
Age distribution is shown for 157 patients from Northern regions of China (black) and 515 patients from the Northern part of the Netherlands (grey). The two curves exhibit a somewhat similar trend with significant differences at the first, second, eighth and ninth decade (* = p<0.01, ** = p<0.001) between the Chinese and the Dutch population (6% vs. 1%, 22% vs. 12%, 1% vs. 7% and 0% vs. 3% respectively). The Chinese population has more patients among the first three decades as compared to the Dutch population, both having the highest peak in the third decade. The Chinese population does not show a second incidence peak at around 60 years.

