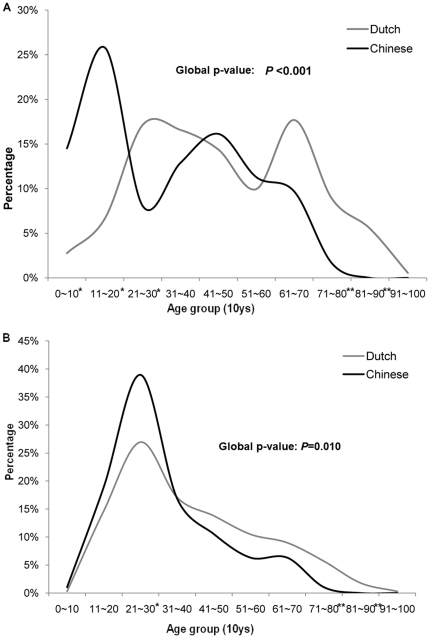
Figure 2. Age distribution of Dutch and Chinese cHL patients stratified by EBV status.
A represents the comparison of the age distribution in the two EBV+ cHL subpopulations. Chinese EBV+ cHL patients (black) exhibited a significant single peak in the first and second decade with a maximum percentage of 26% (* = p<0.01). In contrast, Dutch EBV+ cHL patients (grey) demonstrated a clear bimodal age distribution pattern with two peaks occurring in the third and seventh decade respectively with a similar incidence for both peaks (17% and 18%). B shows the age distribution curve of the EBV- cHL patients. There is a single incidence peak in the third decade for both populations, which is more pronounced in the Chinese population (39% vs. 27%).

