
Figure 3.
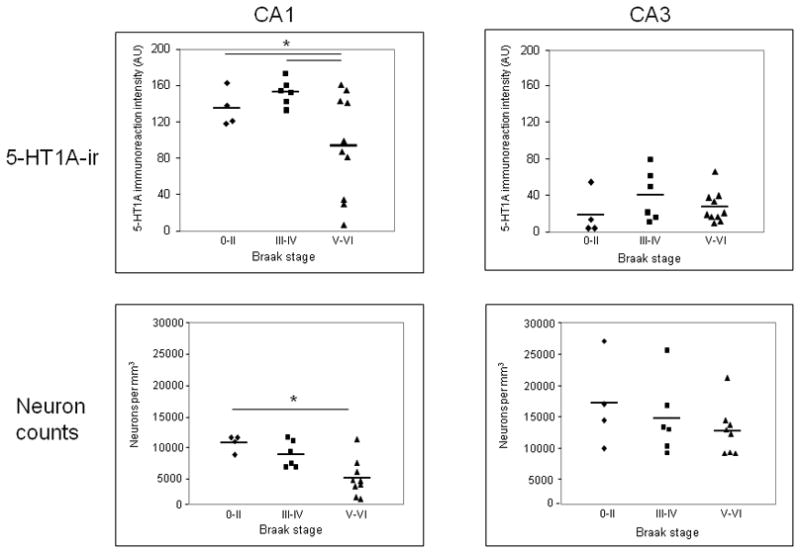
Scatter plots of 5-HT1A immunoreaction intensity values (top) and neuron density measurements (bottom) quantified in hippocampal CA1 and CA3 fields from Braak stage 0–II, III–IV, and V–VI cases. A subset of Braak V–VI cases show significant reductions in both measures in the CA1, but not CA3 region.