
Figure 4.
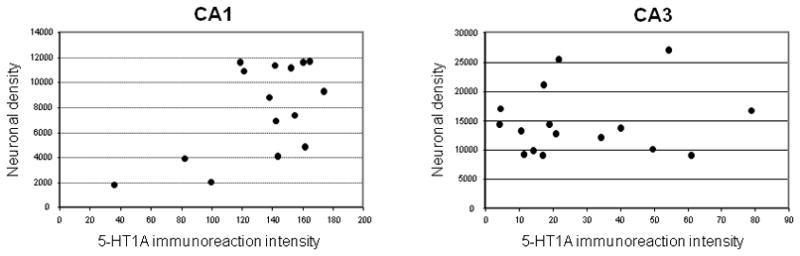
Correlation analysis of 5-HT1A immunoreaction intensity and neuronal density in CA1 and CA3 hippocampus across all cases in the study. The two variables correlated directly in CA1 (r = 0.59, p = 0.009) and not at all in CA3 (r = 0.10, p = 0.35).