
Figure 3.
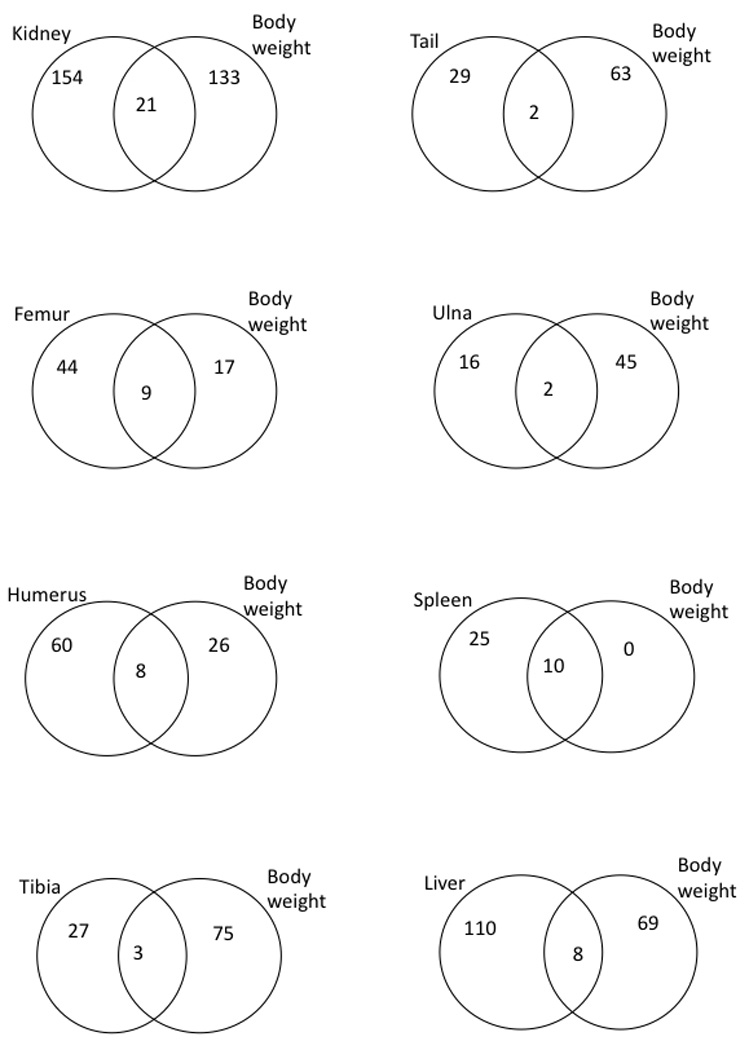
Venn diagrams illustrating the numbers of trait-specific and overlapping interactions, separately for each trait relationship. All presented interactions involve rQTL. Note that in all cases, the number of trait-specific interactions is higher than the number of overlapping ones.