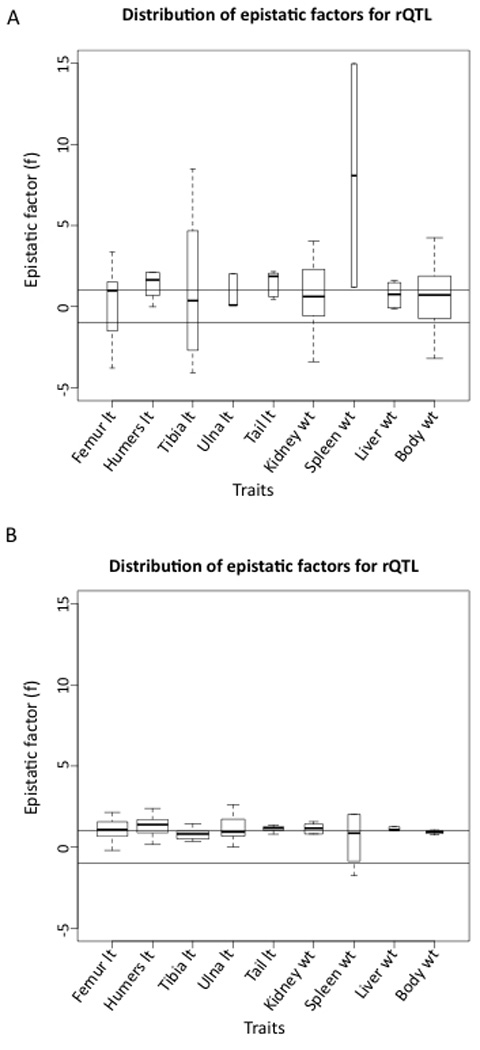
Figure 4.

Distribution of average epistatic factors across loci for each trait. A) Each box in a box plot represents the distribution of average weighed epistatic factors, where weighed averages were calculated within the subset of interactions with single rQTL. Thus boxes show the distribution of average epistatic modifications of rQTL. B) Each box in a plot represents the distribution of average modifications due to epistasis across general interactions (not limited to rQTL). The widths of the boxes are proportional to the number of loci included. lt: length, wt: weight.
