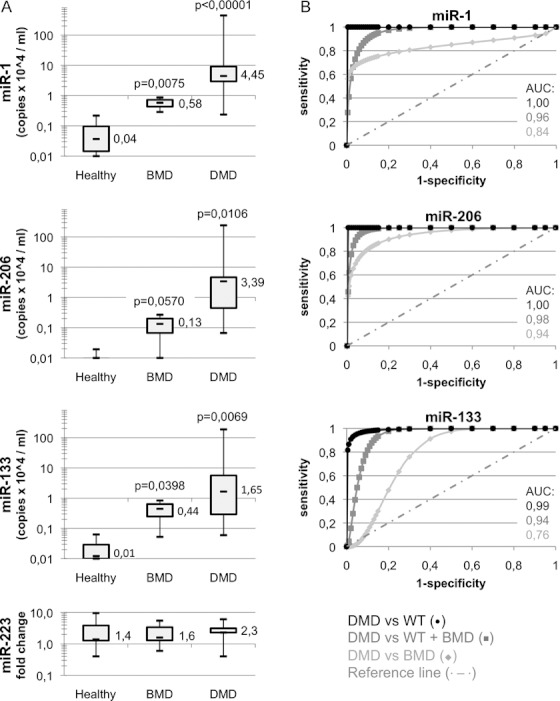
Box plots comparing microRNA levels in the sera of 7 healthy, 26 Duchenne (DMD), and 5 Becker (BMD) patients (patient information is listed in supplementary
Table 1). All data were normalized for three spiked miRNAs (ath-miR-159a, cel-lin-2, and cel-lin-4). miR-1, miR-206, and miR-133 values are shown as copy number per ml of serum. Control miR-223 levels are also shown as fold change values. All values are shown in logarithmic scale.
p-values are derived from the comparison of miRNA levels in DMD or BMD
versus healthy patients.