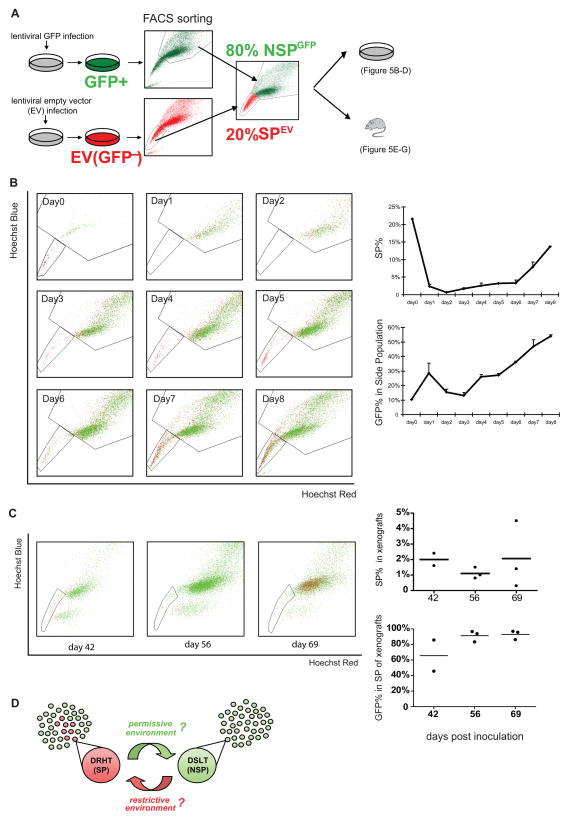
Figure 5. SP cells arise through conversion of NSP cells.
(A) Schematic of GFP experiments: FACS fractionated SPEV cells were mixed with NSPGFP cells at a 20:80 ratio at day 0; 1×10⁵ of the mixed cells were cultured in 6-well plates for in vitro analysis or inoculated into SCID mice for in vivo xenograft tumor analysis. (B) In vitro analysis: Left: Daily FACS plots showing the relative proportions of GFP+ and GFP- cells in the SP and NSP gates over time. Right: Graphs plotting the relative size of SP and the GFP+ proportion within the SP over time. (C) In vivo analysis: Left: FACS plots showing the relative proportions of GFP+ and GFP- cells in the SP and NSP gates at 3 time points. Right: Graphs plotting the relative size of SP and the GFP+ proportion within the SP in xenograft tumors derived from the 20:80 SPEV:NSPGFP J82 cancer cell line. (D) Illustrated model summarizing the direct interconversion observed between the drug-resistant highly-tumorigenic phenotype (DRHT, SP) and the drug-sensitive low-tumorigenic phenotype (DSLT, NSP). This plasticity occurred cyclically in many cells at once, suggesting a possible adaptive response to environmental factors (italicized with question marks).

