
Figure 2. Images from patient 2 with large R fronto-parieto-occipital tumor.
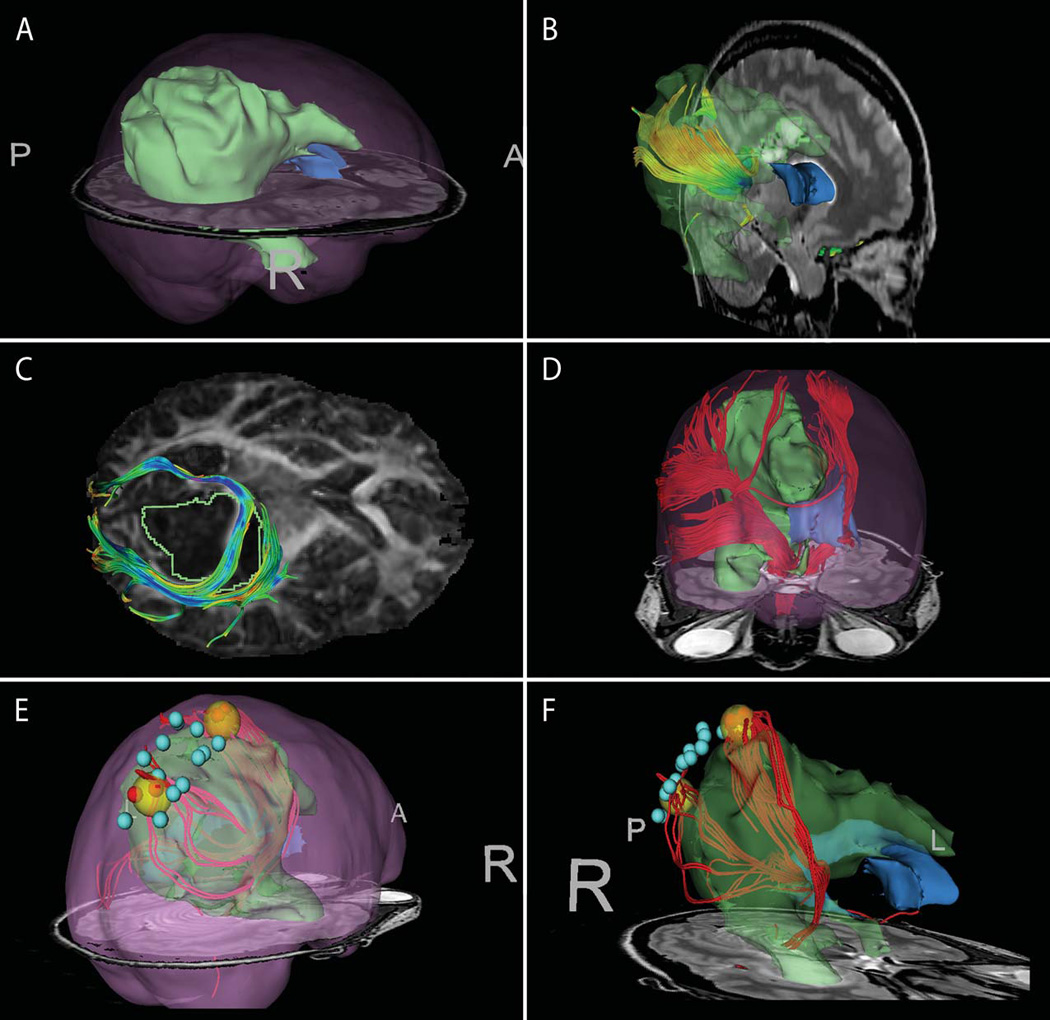
(A) tumor segmentation (green) with brain outline rendering (pink) (B) Seeding within high intensity T2-bright area demonstrates tracts within tumor region. (C) Manually-seeded infiltrating and displaced tracts against the DTI FA map (D) ROI seeding from cerebral peduncle to identify CST. Seeding region was outlined on several T2 slices, and tractography was seeded within this volume.(E–F) offline, post-operative tract seeding from intra-operative cortical stimulation locations (red spheres positive). The yellow spheres represent enlarged seeding area around positive sites in order to seed DTI tracts that do not reach the cortical surface.