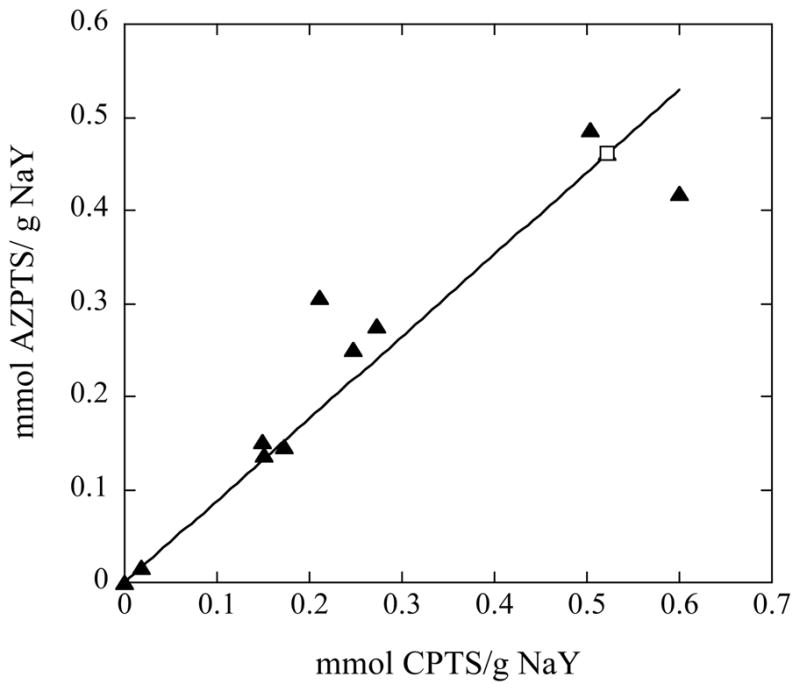
Figure 3.

The CPTS loading (measured by TGA) is plotted versus the subsequent AZPTS loading (measured by TGA). The filled triangles represent data from NaY-Zeolyst samples and the open square represents NaY-nano.

The CPTS loading (measured by TGA) is plotted versus the subsequent AZPTS loading (measured by TGA). The filled triangles represent data from NaY-Zeolyst samples and the open square represents NaY-nano.