Figure 6.
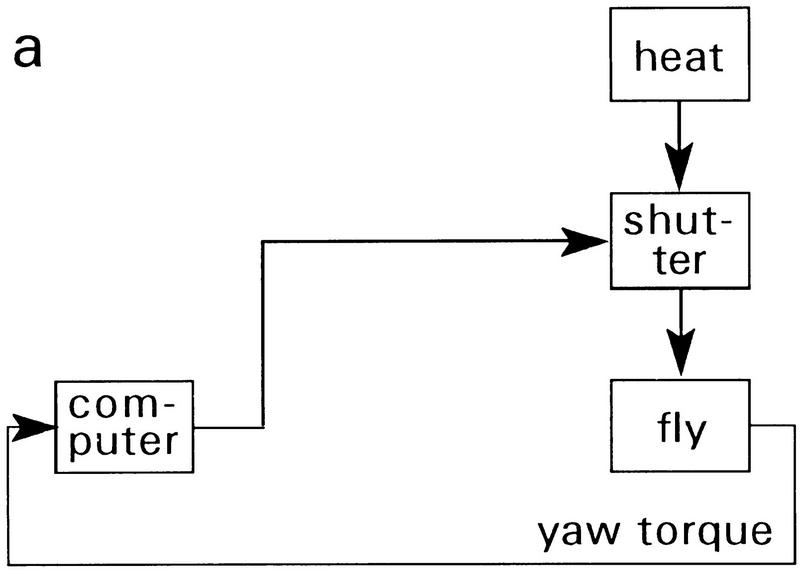
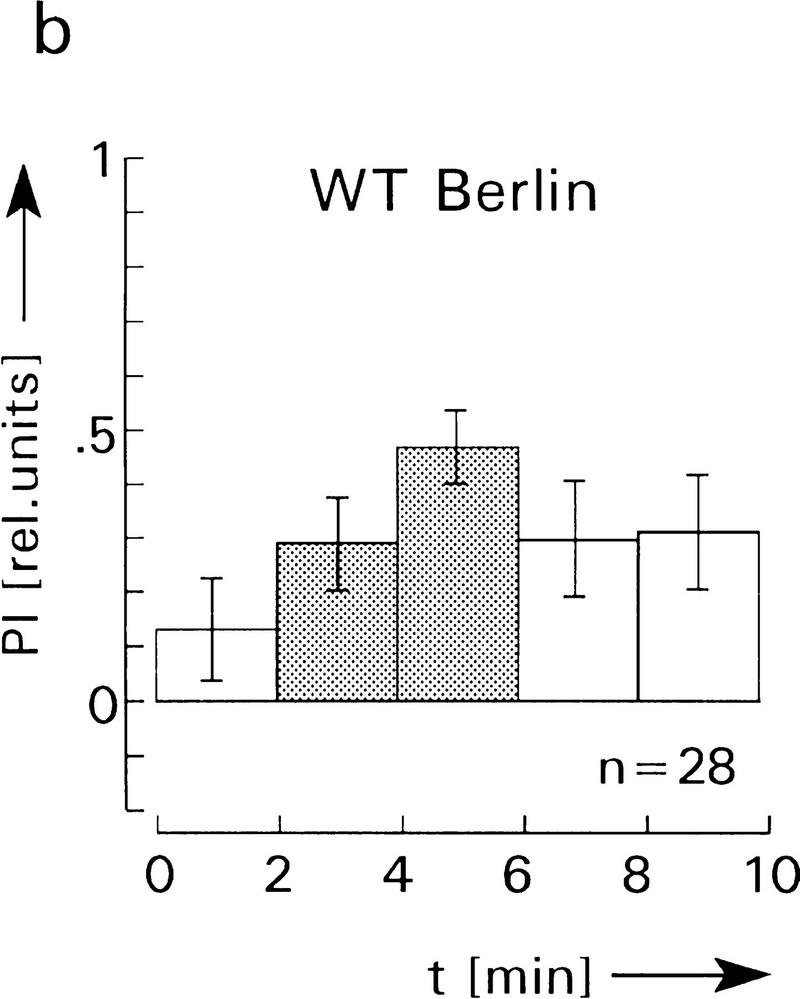
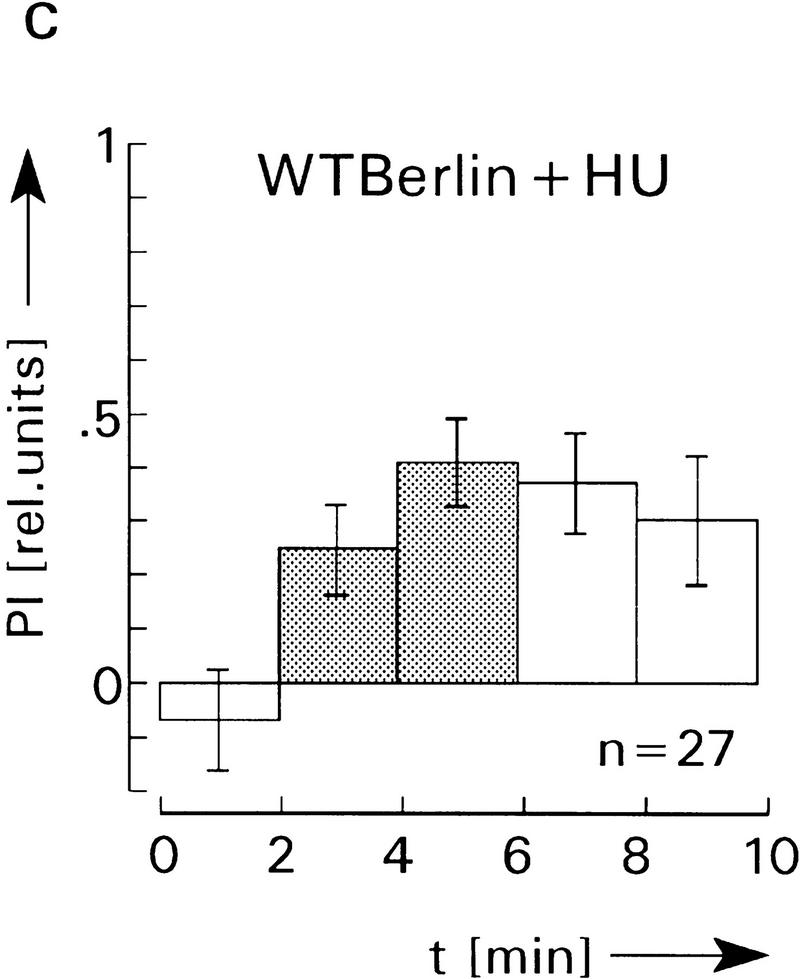
Motor learning at the torque meter. (a) Block diagram of experimental procedure (see text for further explanations). In contrast to the experiments of Figs. 2–5 no visual patterns or motion stimuli are involved. The range of spontaneously generated yaw torque values is recorded and divided by the computer into two domains corresponding roughly to right and left turns in free flight. During training (shaded bars), heat is switched on in one domain and turned off in the other. Flies learn to control the heat by directing yaw torque preferentially to one of the domains. After 4 min of training, flies continue to avoid yaw torque values that had previously been associated with heat (last two bars in b and c). There is no significant difference in memory performance between HU flies (c) and control (b) flies (P > 0.5 for comparison of the corresponding memory PIs). PIs are evaluated as PI = (ta − tb)/(ta + tb) where ta indicates the time during which the shutter is closed and tb the time during which it is opened. Error bars are s.e.m. for the number (n) of flies.


