
Figure 2.
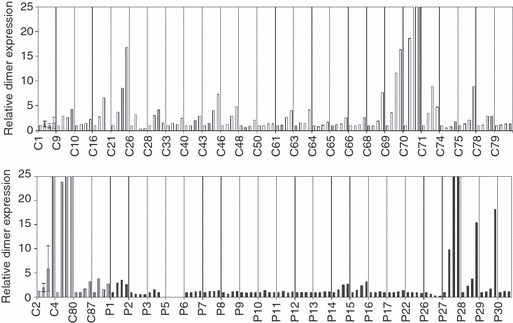
Relative increase in dimer levels with data normalized to T0. Samples were taken at T0, T24, T48 and T72 after lipopolysaccharide (LPS) activation and these are plotted for each sample. Non-B27 healthy controls (shown in white; C1, 9, 10, 16, 21, 26, 28, 33, 40, 43, 46, 48, 50, 61, 63, 64, 65, 66, 68, 70, 71, 74, 75, 78, 79); B27-positive healthy controls (shown in grey; C2, 4, 80 and 87) and patient samples (shown in black; P1, P2, P3, P5, P6, P7, P8, P9, P10, P11, P12, P13, P14, P15, P16, P17, P22, P26, P27, P28, P29, P30).