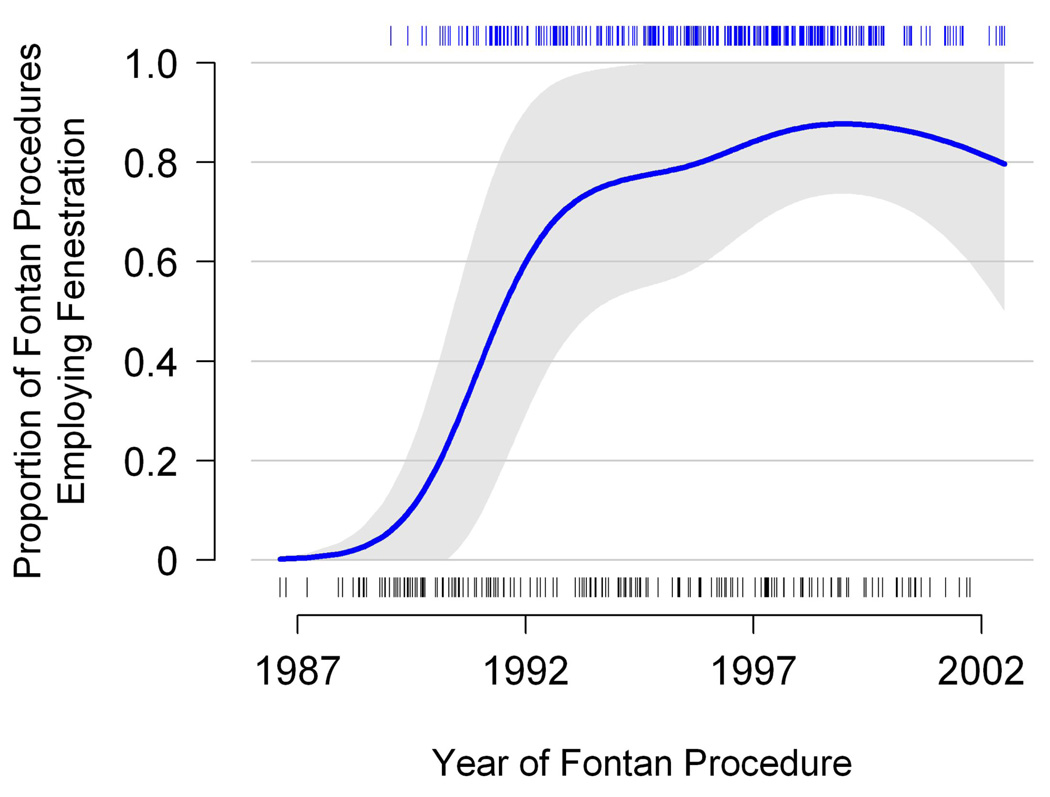
Figure 1. Smoothed proportion of subjects with surgical fenestration, by year.
Rug plots at top and bottom record the dates of fenestrated and non-fenestrated procedures respectively. Estimated were obtained using generalized additive mixed models. A 95% confidence interval is displayed as a shaded region.

