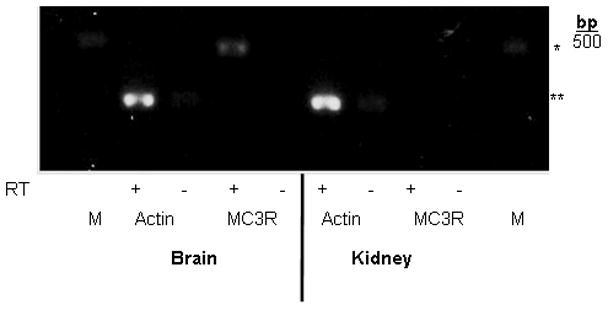
Figure 2. MC3-R gene expression is not detectable by RT-PCR in mouse kidney.

Photograph of gel showing PCR amplification products from wild-type mouse brain and kidney tissue after reverse transcription of actin (loading control) and MC3-R. Samples containing reverse transcriptase (+) or negative controls lacking reverse transcriptase (−) are included for each tissue/primer combination. The end lane on each side contains a 500 base pair marker (M). *denotes the predicted product size for MC3-R (480 bp), and **denotes the product size for actin (285 bp).
