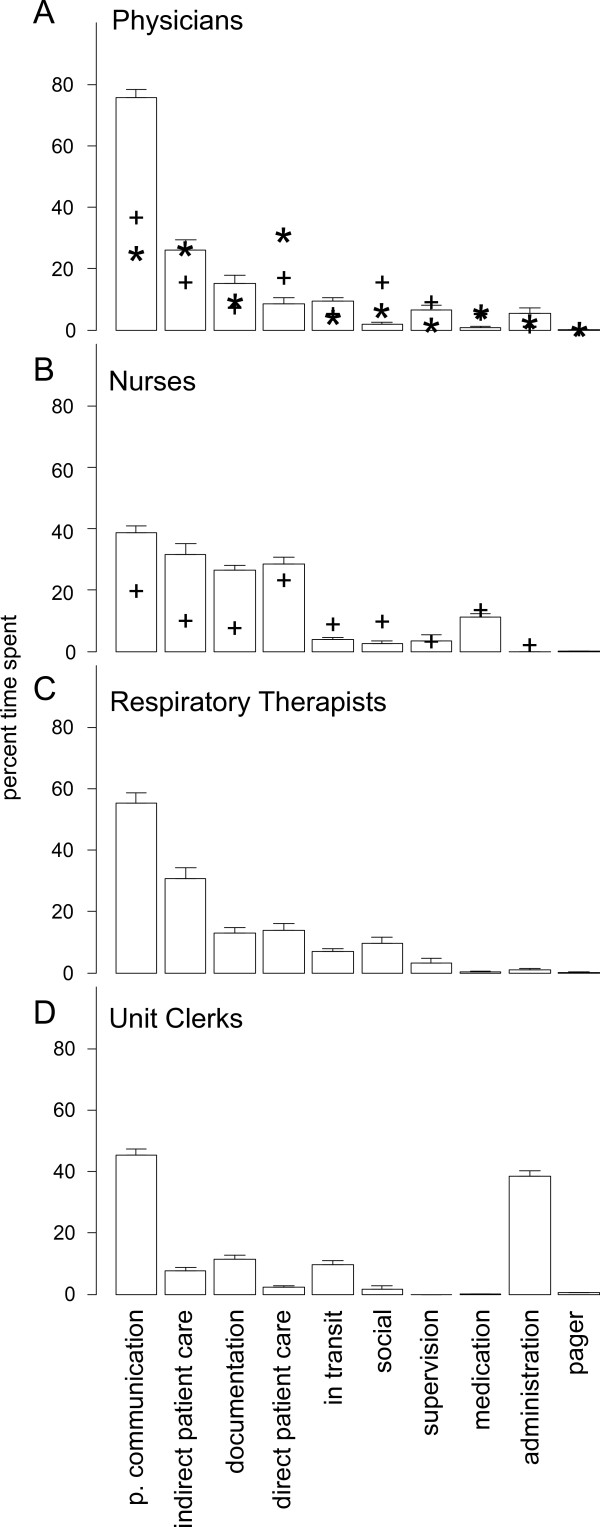
Figure 1.
Time percentages spent performing different tasks by critical care providers. Values represent means and error bars represent 95% confidence intervals. Plus signs (+) in A represent values for percentages of time spent by physicians in general hospital wards on tasks taken from [13], and in B corresponding values for nurses were adapted from [15]. Asterisks in A represent percentage of time spent by physicians working in EDs, adapted from [27]. P. Communication = Professional Communication.

