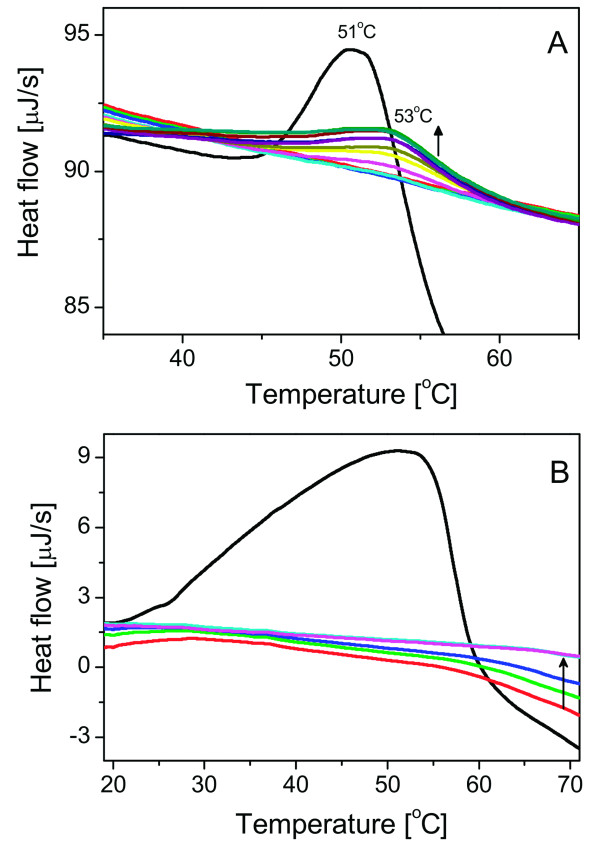
Figure 3.
Results of DSC experiments concerning the DraD-sc denaturation in reducing conditions. (A) The denaturation in presence of 1 mM DTT in the protein sample. The first scan (black) is denoted with melting temperature 51°C. Next scans are denoted with melting temperature 53°C and increase in their intensity (marked with an arrow pointing up). (B) The denaturation in presence of 1 mM TCEP-HCl in the protein sample. The first scan is marked with black line, the rest is shown in color. First three re-heating scans exhibit different level and stabilize after the third re-scan (dark blue).

