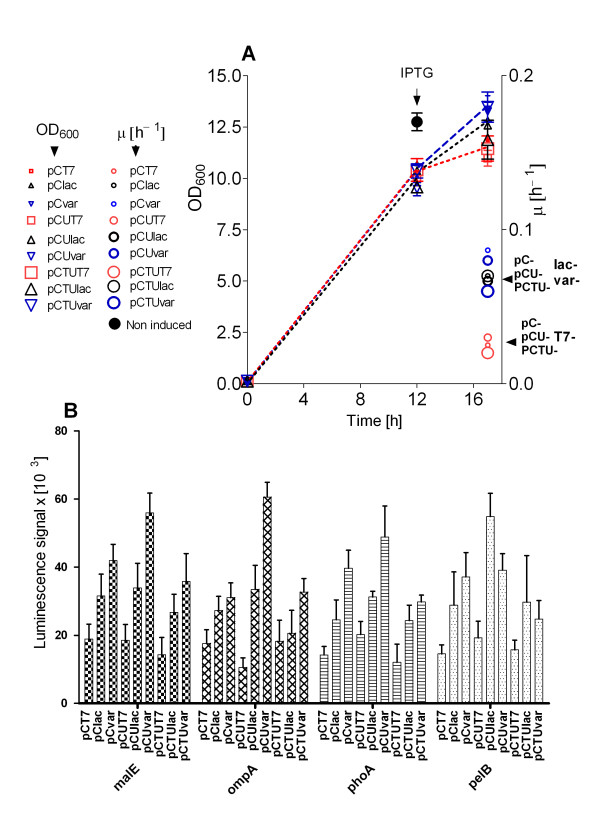
Figure 1.
Growth with EnBase in MWPs of a library of 36 constructs with periplasmic RI production and luciferase activity of the different clones. A: OD600's are shown for all cultures of the vector library. Label sizes represent promoter strength [from weakest (pC, smallest labels) to strongest (pCTU, largest labels)]. Label shapes and colours represent ribosome binding strengths: T7 (red squares), lac (black triangle), var (blue triangle). Sizes and colours of the specific growth rate labels (circles) also indicate promoter and ribosome binding site strengths. B: The periplasmic aggregation signal measured as luminescence in samples of the RI expression library 5 h after induction. The data represent three independent cultivation experiments of the whole library.

