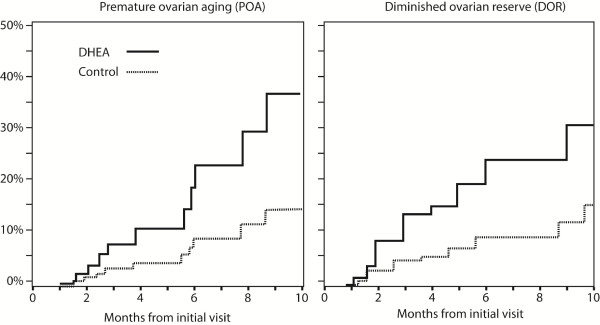
Figure 2.
Cumulative pregnancy rates in women with DOR with and without DHEA supplementation. The figure demonstrates on the left side cumulative pregnancy rates in DHEA and control patients with POA (for definition see text). The right side of the figure demonstrates cumulative pregnancy rates in women above age 40 years. Both patient populations demonstrate similar treatment benefits for DHEA, though POA patients appear to have a slight pregnancy advantage, further confirmed in later data presentations. Modified with permission from Barad et al [17].

