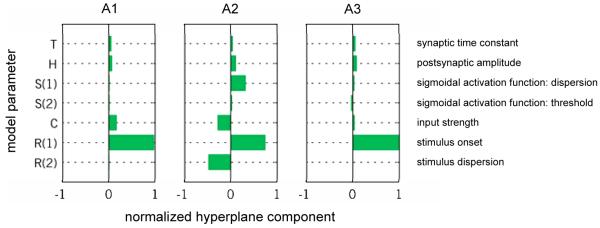
Fig. 6. Reconstructed feature weights (dataset 1).
In order to make predictions, a discriminative classifier finds a hyperplane that separates examples from the two types of trial. The components of this hyperplane indicate the joint relative importance of individual features in the algorithm’s success (for parameter descriptions see Table 1a). The diagram shows the normalized value of the hyperplane component (x-axis) for the posterior expectation of each model parameter (y-axis). Feature-weight magnitudes sum to unity, and larger values indicate higher discriminative power (see main text). Consistent across all three experiments, the parameter encoding the stimulus onset (R1) was attributed the strongest discriminative power.

