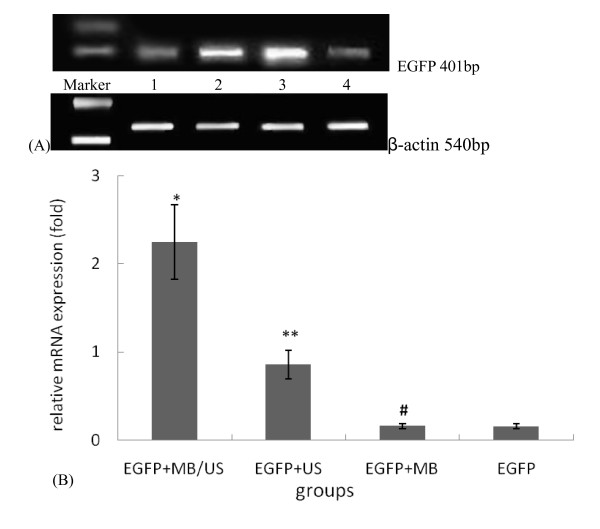
Figure 2.
EGFP mRNA expression in injection regions of the myocardium for four different treatment groups, as evaluated using RT-PCR technology. ( ± sd, n = 4). (a)M: marker; 1 lane: EGFP group; 2 lane: EGFP + US group; 3 lane: EGFP +MB/US group; 4 lane: EGFP +MB group. (b) *P < 0.01 vs. EGFP group and EGFP+ MB group; **P < 0.01 vs. other three groups. # P > 0.05 vs. the EGFP group. β-actin was used as the internal control.

