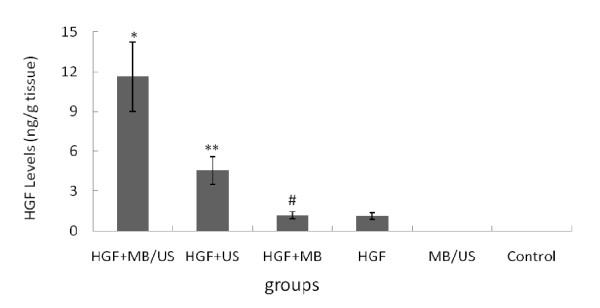
Figure 4.
Analysis of HGF content in the myocardium as measured by ELISA for four different treatment groups. HGF protein expression was assessed at day 28 after transfection ( ± sd, n = 6). *P < 0.01 vs. other five groups; **P < 0.01 vs. HGF +MB group and HGF alone group; # P > 0.05 vs. HGF alone group.

