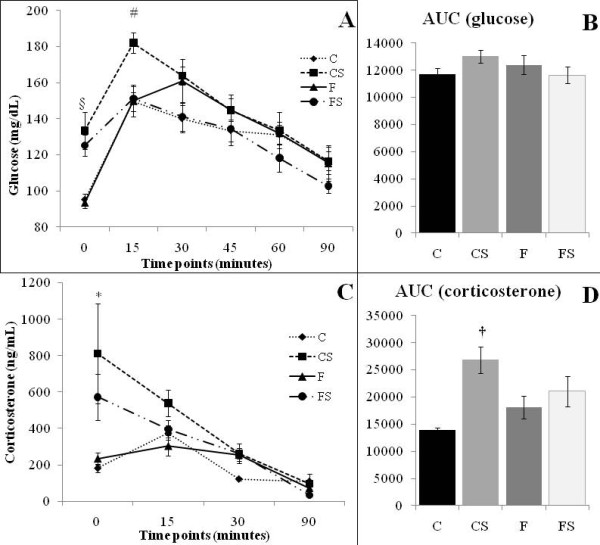
Figure 1.

OGTT-Oral Glucose Tolerance Test (A), glucose AUC (B) serum corticosterone levels (C) and corticosterone AUC (D) of Control (C), Stressed (CS), Fish Oil (F) and Fish oil Stressed (FS) groups. Data are means ± SEM. N = 6 rats/group. * Different from Control (C) group p < 0.05. † Stressed rats (CS) different from non stressed rats (C and F). § Footshock-stressed rats (CS and FS) different from non stressed rats (C and F) p < 0.05. # Different from all other groups p < 0.05.
