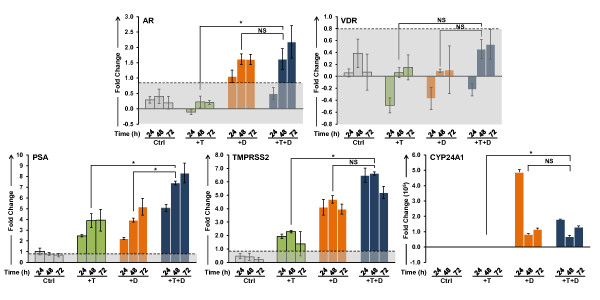
Figure 3.
Validation of changes in the mRNA levels of AR, VDR, PSA, TMPRSS2 and CYP24A1. LNCaP cells were treated with 5 nM T and 100 nM 1,25(OH)2D3 alone and in combination and transcript levels were measured by Real Time-PCR over a 72 h time course. Fold changes greater than 0.8 are statistically significant; values within the shaded areas in each graph are not significantly modulated (0.8 or below after transformation). Comparisons between different treatment groups were analyzed using one-way ANOVA; differences were considered significant if p < 0.05 (*), NS: not significant. Significant changes (p < 0.05) in at least two out of three time points were required for the changes to be considered biologically relevant. Note: Scales on the ordinate axis vary from transcript to transcript.

