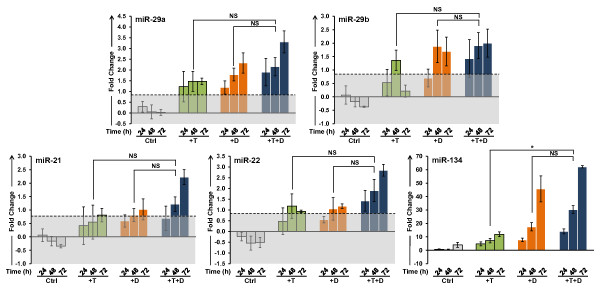
Figure 7.
Validation of induction of steady state levels of miR-29a, miR-29b, miR-21, miR-22, and miR-134. LNCaP cells were treated with 5 nM T and 100 nM 1,25(OH)2D3 alone and in combination and transcript levels were measured by TaqMan® qPCR over a 72 h time course. Other details as shown in Figure 3.

