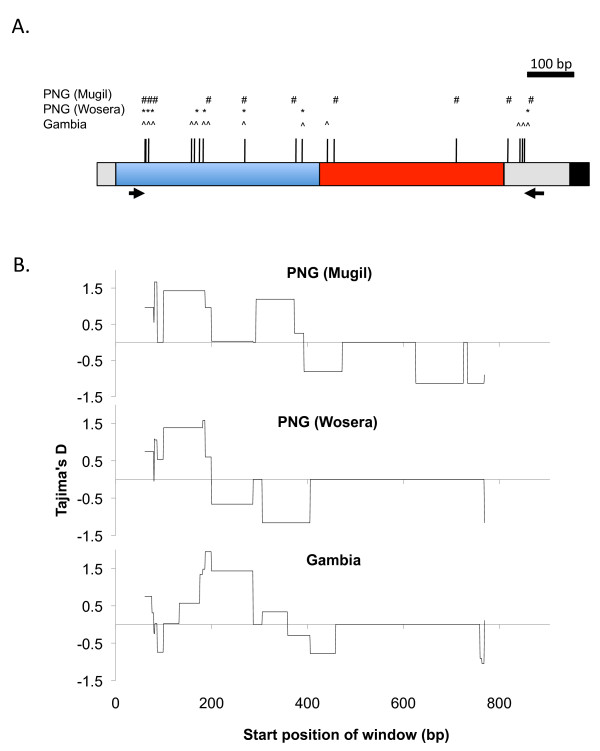
Figure 1.
Pf38 domain structure, polymorphism and signatures of natural selection. (A) Map of the Pf38 gene indicating the positions of primers (arrows), 6-cys domain I (blue) and domain II (red) and GPI anchor (black). Bars indicate positions of SNPs, with symbols above indicating those found in each natural population (B) Sliding window analysis of natural selection (Tajima's D values) for each population. Window size = 100bp, Step size = 3 bp.

