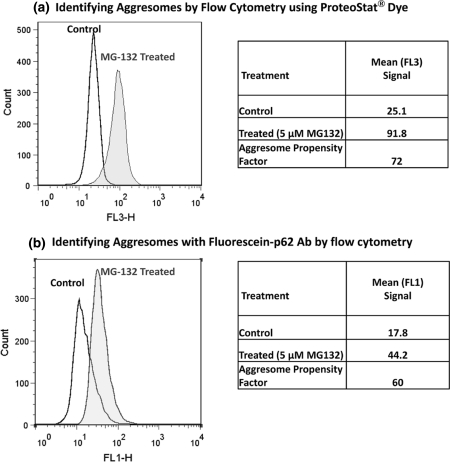
Fig. 8.
Identifying protein aggregation by flow cytometry: Jurkat cells were mock-induced with 0.2% DMSO or induced with 5 μM MG-132 for 16 h at 37°C. After treatment, cells were fixed and incubated with a ProteoStat® dye, or b fluorescein-labeled p62-reactive antibody. Then, the samples were analyzed by flow cytometry. Results are presented as histogram overlays. In MG-132 treated cells, ProteoStat® dye red fluorescence signal increases about 3-fold (shown in panel A) while the fluorescein signal increases about 2.5-fold (shown in panel B)

