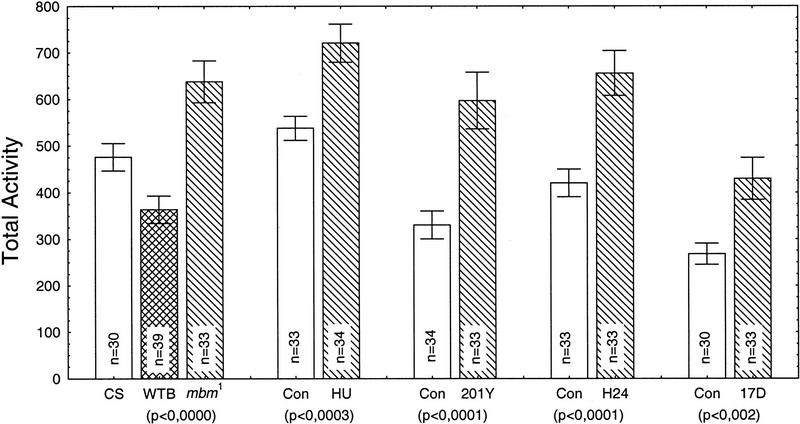
Figure 2.
Total walking activity during 4.5 hr for each group of MB-disturbed flies compared to their respective controls. (CS) Canton-S; (WTB) WT-Berlin; (Con) Control. Total activity is represented as the mean ±s.e.m. over n (number in each column) flies. For each group, a one-way ANOVA of total activity revealed significant difference (P value below each group column). The P value below the WTB-mbm1 column is for the WT-Berlin and mbm1 comparison only (CS not included).

