
Figure 1. Changes in Kir2.1 channel activity report the enzymatic activity of Ci-VSP at high membrane potentials.
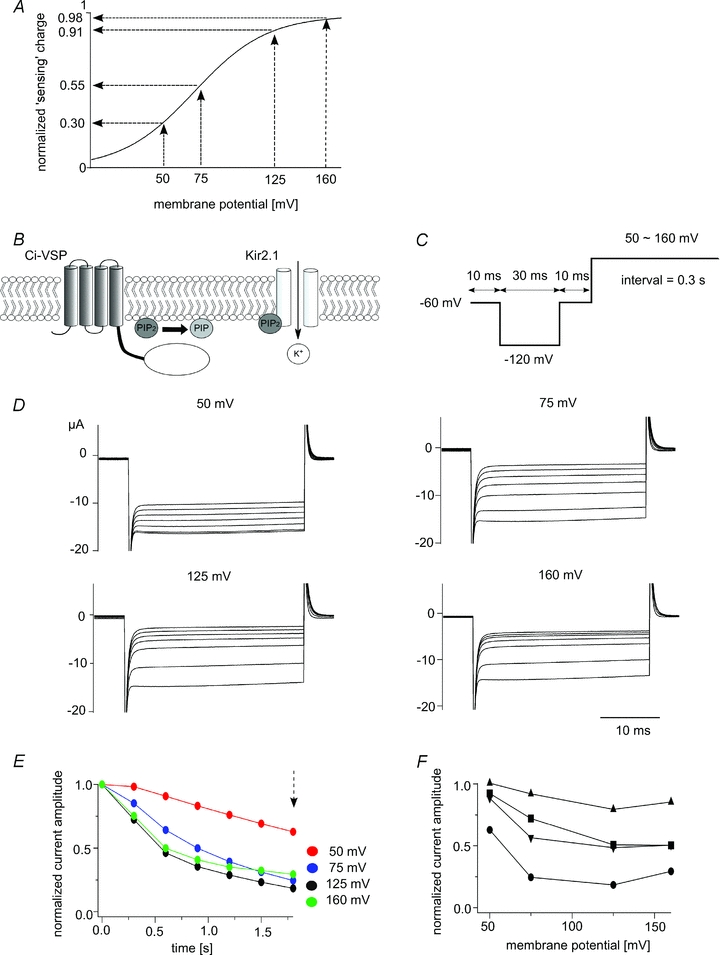
A, relative amplitude of the ‘sensing’ charge at four membrane potentials. The Q–V curve follows the Boltzmann equation: Q = 1/(1 + exp(zF(V1/2–V)/RT)), z = 1.09, V1/2 = 69.8 (Murata & Okamura, 2007). B, scheme for the measurement of the voltage-dependent phosphatase activity of Ci-VSP using Kir2.1 K+ channels. PI(4,5)P2 is depleted when Ci-VSP is activated, which leads to a decline in Kir2.1 channels activity. C, pulse protocol used under TEVC. D, families of the Kir2.1 currents elicited when the interval voltages were set to 50, 75, 125 or 160 mV. Kir2.1 currents elicited during repetitive test pulses to −120 mV applied every 0.35 s are superimposed. Data sets for interval voltages of 50 to 160 mV were collected from the same oocytes. E, plots of the normalized current amplitudes derived from the data sets shown in D. The amplitude of the inward Kir2.1 current at each repetition was normalized to the magnitude at the first episode. Current amplitude was measured as the average of the last 10 ms of the test pulse stepped to −120 mV. F, voltage dependency of the reduction in Kir2.1 current amplitude in four oocytes. Normalized current amplitudes measured 1.8 s after the onset of the pulse protocol (dotted arrow in E) are plotted. Different symbols show data from different oocytes.