
Figure 4. Voltage-dependent reductions in Kir2.1 currents recorded in the on-cell patch configuration.
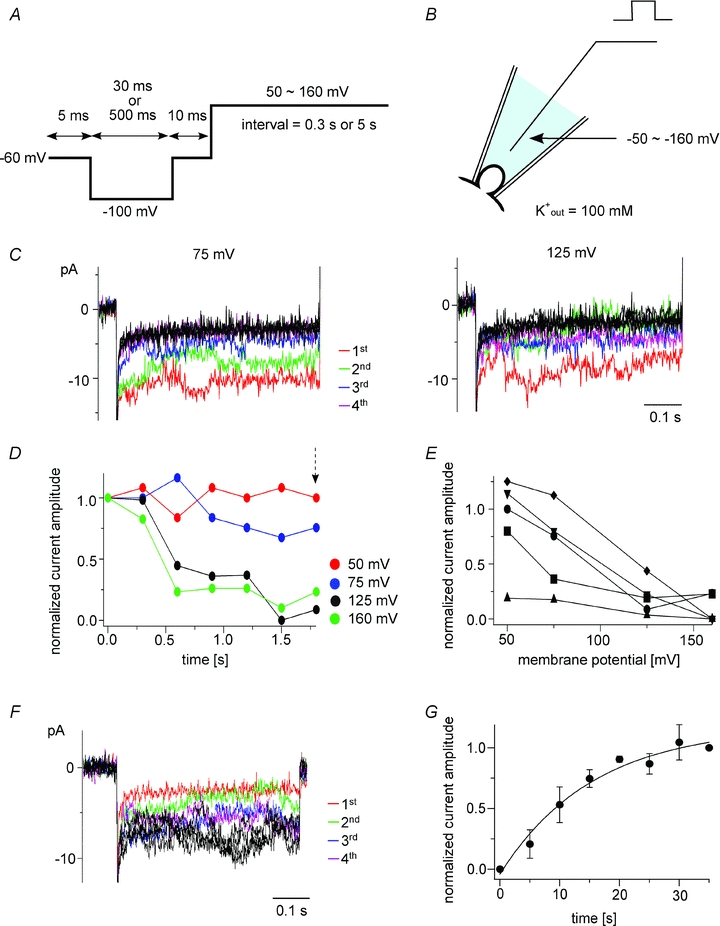
A, pulse protocol for measuring Kir2.1 currents dependent on Ci-VSP phosphatase activity. B, scheme of the on-cell patch configuration. The bath solution contained 100 mm K+ in order to clamp the cell membrane close to 0 mV. C, families of Kir2.1 currents recorded when the interval voltage was set to 75 or 125 mV. Current traces elicited during repetitive test pulses to −100 mV applied every 5.5 s are superimposed. D, time course of the normalized current amplitudes for the indicated pulses. All data were collected from the same patch. Each current amplitude was calculated by subtracting the current evoked by the final test pulse, when the interval voltage was set to 160 mV. E, voltage dependence of the reduction in Kir2.1 current amplitude in five patches. Normalized current amplitudes measured 1.8 s after the onset of the pulse protocol (arrow in D) are plotted. The same symbols show the data from single oocytes. F, recovery of Kir2.1 currents following stimulation using the protocol shown in A. Current traces evoked during repetitive test pulses to −120 mV applied every 5 s are superimposed. The holding potential was −60 mV. G, plots showing the recovery of Kir2.1 activity after depolarization to 75 mV. The symbols are means ± SD (n = 3). The line is the curve fitted with a single exponential formula. The average time constant was 15.6 s.