
Figure 8. The level of Ci-VSP expression influences the sharpness and the timing of the fluorescence decay.
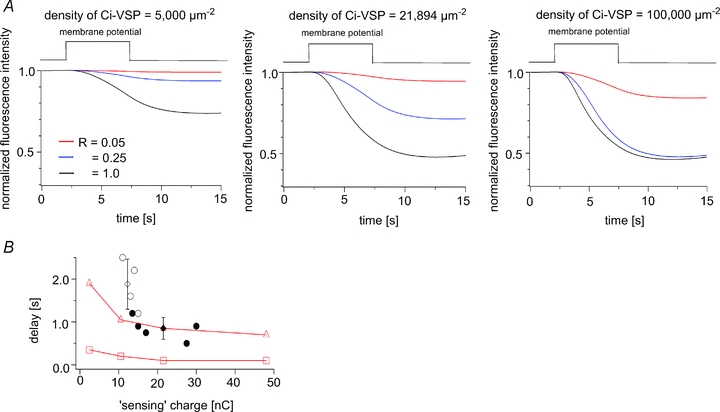
A, simulation of PHPLC-GFP fluorescence showing the changes occurring at the three indicated Ci-VSP densities. D = 4.5 μm2 s−1. Note that the sharpness of the decay depends on the level of Ci-VSP expression. B, relationship between the delay and the maximum ‘sensing’ charge. The definition of the delay time is described in the legend of Fig. 6H. Red triangles and squares indicate the decay estimated from the model with and without diffusion, respectively. Open and filled circles indicate the data from type I and type II oocytes, respectively. The delay times in type I oocytes were significantly longer than in type II oocytes (1.8 ± 0.6 s (open diamonds) vs. 0.9 ± 0.3 s (filled diamond), mean ± SD; P < 0.01).