
Figure 9. Voltage dependence of Ci-VSP phosphatase activity calculated from the PHPLC-GFP fluorescence studies.
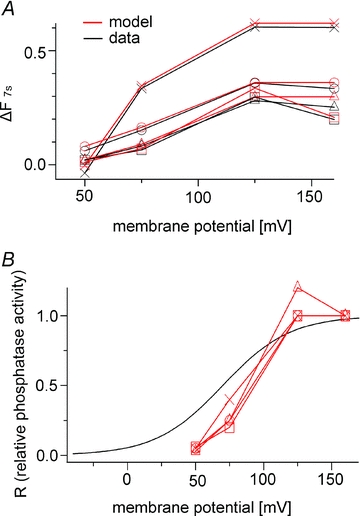
A, each set of experimental data was fitted with the model. The enzyme activity at 160 mV was defined such that R = 1, and the data obtained at 50 mV, 75 mV and 125 mV were fitted by changing the R value in individual oocytes. B, R values estimated in A are plotted against the membrane potential together with the Ci-VSP ‘sensing’ charges (black line). The Q–V curve was derived from the Boltzmann equation: Q = 1/(1 + exp(zF(V1/2–V)/RT)), z = 1.09, V1/2 = 69.8 (Murata et al. 2005). Red lines indicate R. In A and B, data from four oocytes are shown as different symbols.