
Figure 11. Model prediction of the recovery of Kir2.1 currents.
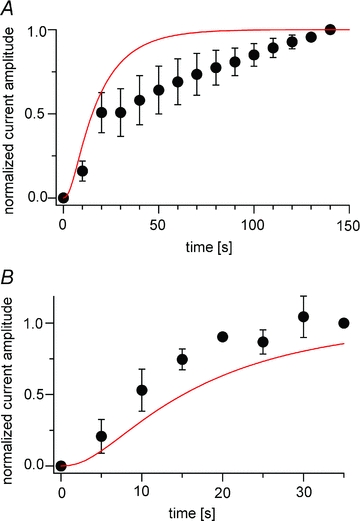
A and B, the predicted recoveries of PI(4,5)P2 and the Kir current are superimposed on the experimental data obtained in the TEVC (A) and on-cell patch (B) configurations. Red lines represent the Kir current recovery predicted by the simulation. The experimental data shown here are the same as those shown in Figs 3B and 4G, respectively.