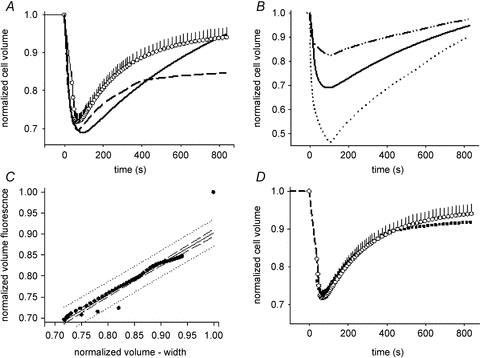
Figure 3. Equating changes in muscle calcein fluorescence with changes in cellular volume.

A, time course of change in cell volume during exposure to a 35% increase in extracellular osmolarity. Normalized cell volume was calculated using change in width (○, with SEM bars; n = 8 sections from 4 fibres from 2 mice; [1 – (Wo–Wt)]/Wo), or using change in fibre fluorescence intensity ([1 – (Fo–Ft)]/Fo), dashed line), and using Crowe et al.'s (1995) equation with our experimentally determined Fbkg of 0.43 (continuous line; same continuous line as in B). This correction for background or ‘trapped’ intracellular fluorescence produced a result that was not statistically different from the fibre width data, but clearly has shortcomings with respect to accurately portraying the time course of volume recovery. B, average (n = 8 sections from 4 fibres from 2 mice) change in normalized cell volume calculated as the ratio of the baseline fluorescence (Fo): fluorescence at time t (Ft) (dashed–dotted line) and using eqn (1) using Crowe et al.'s (1995)Fbkg of 0.67 (dotted line) and our experimentally determined Fbkg of 0.43 (continuous line; same continuous line as in panel A). C, linear regression analysis results of fitting the ‘corrected’ fibre fluorescence (continuous lines of A and B) to the change in volume based on fibre width. D, the time course of change in cell volume calculated from change in fibre width (same data as in A) and from the final fluorescence data (▪) corrected for Fbkg (0.43) and fitted using the linear regression equation.
