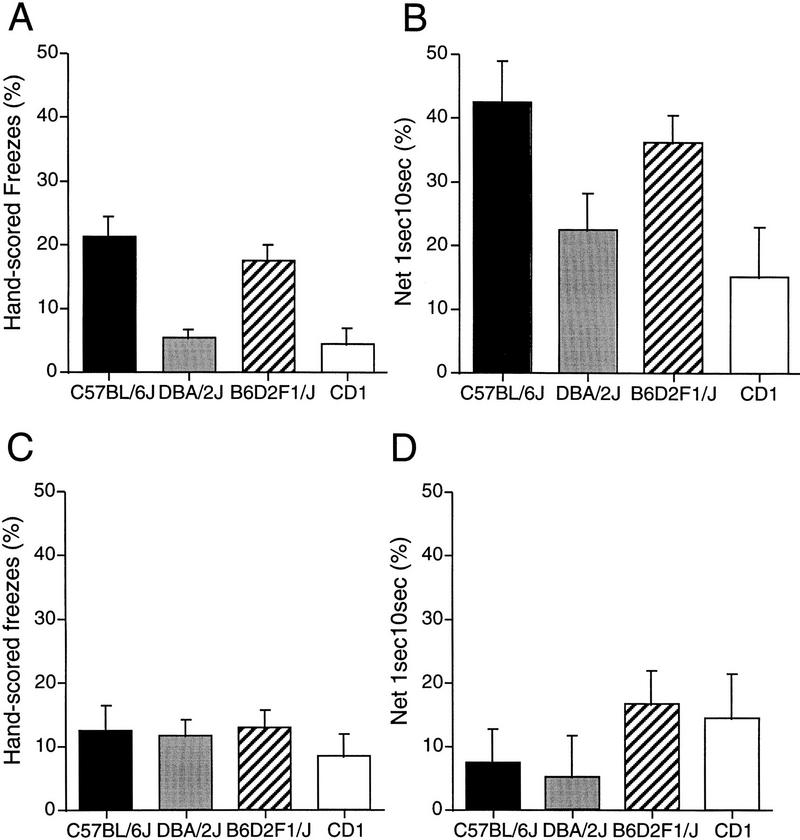
Figure 3.
Mean ± s.e.m. of percent hand-scored freezes during context testing (A), percent 1sec10sec baseline-corrected measures during context testing (B), percent hand-scored freezes during auditory-cued testing (C), percent 1sec10sec measures during auditory-cued testing (D), for C57BL/6J, DBA/2J, B6D2F1/J, and CD1 strains of experiment II.

