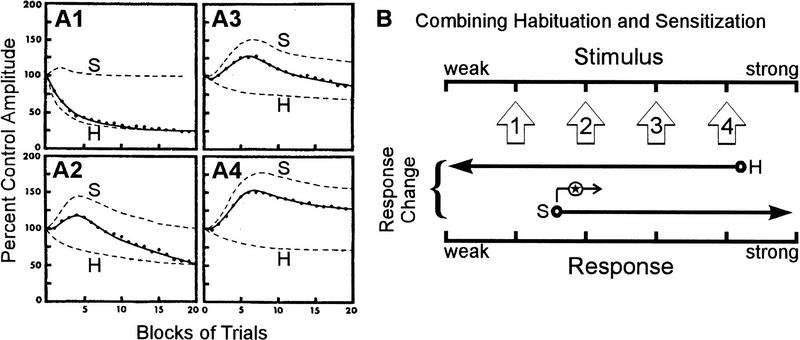
Figure 1.
The combination of habituation and sensitization to produce dual-process learning. (A1–A4) Decomposition of dual-process learning curve (solid line) into component habituation learning curve (broken line labeled H) and habituating sensitization learning curve (broken line labeled S) at four different stimulus intensities increasing between A1 and A4. Empirical data are shown as dots. (B) The contribution of opposing processes at different stimulus intensities. Stimulus intensities used in A are illustrated as open arrows pointing along the stimulus axis. Below each of these arrows are shown the learning processes recruited at that stimulus intensity. The arrow marked H indicates habituation (response decrement by depression); the arrow marked S indicates sensitization (response increment by facilitation). Stimulus 1 elicits strong habituation; stimulus 4 elicits only weak habituation but also elicits strong sensitization; stimuli 2 and 3 are intermediate. An important addition to this interaction is that the lower limit for eliciting sensitization increases (indicated by arrow marked with star) consequent to depression early in the neural circuit (see text), meaning that the balance between habituation and sensitization shifts in favor of habituation over time, explaining the bumpy shape of the curves seen in A. A is reprinted, with permission, from Groves and Thompson (1970). Copyright 1970 by the American Psychological Association.

