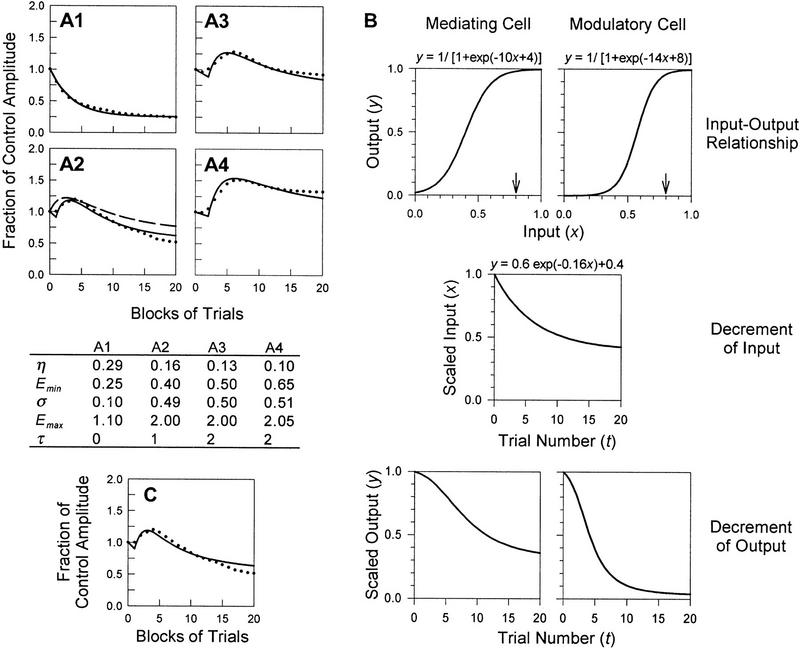
Figure 7.
Application of the model. (A1–A4) Curve fits of data from the spinal cat. A1–A4 correspond to A1–A4 in Fig. 1. Solid lines represent learning curves for conditions of serial induction and serial expression of learning; the broken line in A2 shows an example of a learning curve for serial induction and parallel expression (for discussion of curve fitting technique, see text). For the former case, parameter values are shown in the table. (B) Enhancement of habituation of sensitization compared with response habituation. The logistic function relates a neuron’s input to its output, resulting in a sigmoidal input–output curve (top graphs). Assuming a high threshold to recruit sensitization, the input–output curve for a modulatory cell is shifted right and is steep compared with the analogous curve for a mediating cell. Using the example of a stimulus of strength x = 0.8 (small arrows), equivalent decrement of input (middle graph) will cause more rapid decrement of modulatory cell output than mediating cell output (bottom graphs). The value of x is determined by the stimulus intensity; however, values for input and output are scaled to starting values of 1 for plotting against t, so as to be consistent with other learning curves. (C) Example of curve fit after nonlinear transformation. The data points are the same as those shown in A2. The solid line shows the improved fit (compare with broken curve in A2) after a transformation of the sort described in B, wherein the rate and degree of sensitization’s habituation is increased compared with response habituation.

